

Best for revenue-linked budget decisions: Paid Lens. Best for repeatable client reporting: AgencyAnalytics. Best for custom Google-focused dashboards: Looker Studio. This 2026 guide compares marketing analytics dashboard software for agencies by reporting workflow, revenue context, and the decisions each option helps you defend.
- Paid Lens is the pick for agencies seeking ranked, evidence-backed budget recommendations tied to CRM revenue.
- Choose marketing analytics dashboard software for agencies around client reporting needs, attribution requirements, and budget decisions.
- AgencyAnalytics fits recurring client reporting; Looker Studio fits custom Google-focused dashboards.
- Whatagraph fits cross-channel marketing presentation; Microsoft Power BI fits centralized data modeling.
Why this matters
A client dashboard and a budget recommendation solve different problems. A dashboard shows performance. A defensible recommendation explains what to change, which evidence supports it, and where uncertainty remains.
For agencies, that distinction affects both client delivery and account management. A polished report still leaves you exposed when the client asks why one channel deserves more spend than another.
Your 2026 shortlist should start with the meeting you need to support, not the chart you want to build. Separate reporting requirements from decision requirements before comparing software.
What makes the best agency analytics dashboard
Use these criteria to judge marketing analytics dashboard software for agencies. They explain the use-case ranking below; there is no claim that one platform wins every workflow.
- Revenue context: Can you connect advertising activity with qualified pipeline and revenue, rather than stopping at platform conversions?
- Client separation: Can your team keep client accounts, permissions, definitions, and reporting outputs distinct?
- Recurring delivery: Does the workflow support repeatable reporting without rebuilding the same presentation each cycle?
- Metric consistency: Can you maintain agreed definitions for leads, opportunities, revenue, and reporting periods?
- Decision evidence: Can you explain the rationale and limits behind a proposed budget change?
- Maintenance burden: Who owns connectors, transformations, dashboard changes, and data-quality checks after setup?
Treat these as acceptance criteria, not a feature-count contest. A reporting-first agency and an agency defending cross-channel reallocations need different answers.
Agency analytics software at a glance
| Option | Best for | Standout capability | Key limitation |
|---|---|---|---|
| Paid Lens | Revenue-linked budget decisions | Ranked, evidence-backed budget reallocation recommendations | Decision support does not replace a defined client-reporting workflow |
| AgencyAnalytics | Repeatable client reporting | Agency-focused dashboards and reporting automation | Reported performance still needs interpretation before budget changes |
| Looker Studio | Custom Google-focused dashboards | Flexible reports connected to Google data sources | Data preparation and connector maintenance remain separate responsibilities |
| Whatagraph | Cross-channel marketing presentation | Marketing-focused reporting across data sources | A combined report does not establish causal channel contribution |
| Microsoft Power BI | Centralized data modeling | Data transformation, semantic modeling, and interactive reports | Requires ownership of the model, access controls, and report maintenance |
The order prioritizes the article's central problem: connecting agency reporting to a defensible decision. The individual recommendations serve distinct workflows rather than competing for an unsupported universal score.
1. Paid Lens: best for revenue-linked budget decisions
This decision-intelligence platform connects advertising, CRM, analytics, and revenue data to produce ranked, evidence-backed budget reallocation recommendations. Its stated scope includes Google Ads, Meta, LinkedIn, Salesforce, HubSpot, and Google Analytics.
The product-update material identifies a prioritized decision queue, expected business impact, confidence scoring, and pipeline-aware recommendations. Those capabilities address the question that a dashboard alone leaves unanswered: which budget decision should the team review first?
Paid Lens pros:
- Prioritizes proposed actions instead of requiring you to interpret every chart independently.
- Connects the recommendation to business impact and CRM context.
- Makes confidence and supporting rationale part of the decision discussion.
Paid Lens cons:
- Recommendation quality still depends on consistent source data and CRM definitions.
- The decision-intelligence scope is not a substitute for verifying your client-reporting, export, or branding requirements.
Best for: Agencies and marketing leaders who must explain cross-channel budget changes in revenue terms.
For your 2026 evaluation, confirm the live connection status of each required source. Keep beta and coming-soon connections separate from the capabilities you depend on today. Review recommendations before approving any change; a confidence score is evidence to examine, not permission to skip judgment.
Verdict: Buy for revenue-linked decision support only after validating the private beta against your actual client workflow.
2. AgencyAnalytics: best for repeatable client reporting
AgencyAnalytics provides dashboards and reporting workflows designed around agency client accounts. Its established capabilities include white-label reporting, integrations with marketing platforms, and automated report delivery.
That focus makes it a practical shortlist candidate when the recurring deliverable is the main problem. You want account teams to work from a repeatable reporting structure, not assemble a fresh collection of screenshots for each client meeting.
AgencyAnalytics pros:
- Aligns dashboard organization with agency client reporting.
- Supports branded reporting for client-facing delivery.
- Automates recurring reports rather than relying entirely on manual presentation assembly.
AgencyAnalytics cons:
- Reporting automation does not remove the need to check source definitions and data quality.
- A dashboard comparison does not, by itself, explain which channel caused incremental revenue.
Best for: Agencies standardizing recurring reports across multiple client accounts.
Test the full delivery process, not just the dashboard editor. Have an account manager create a report, review it, and explain a change in performance without help from the person who configured the account.
Verdict: Buy when repeatable client reporting is the primary requirement; keep budget interpretation as a separate review step.
3. Looker Studio: best for custom Google-focused dashboards
Looker Studio lets you build interactive reports using connected data sources. Its Google connections include Google Analytics and Google Ads, making it a natural candidate for reporting built around those systems.
Its flexibility is the advantage. You control report structure and presentation, but you also own the decisions about source selection, calculated fields, blended data, and metric definitions.
Looker Studio pros:
- Supports custom report layouts rather than a single prescribed agency reporting format.
- Connects directly with major Google marketing data sources.
- Provides calculated fields, filters, and interactive controls for tailored analysis.
Looker Studio cons:
- Cross-source reporting requires attention to join logic, aggregation, and connector behavior.
- Flexible templates need governance if different account teams modify definitions independently.
Best for: Agencies with Google-focused clients and someone responsible for report configuration.
For a 2026 evaluation, build the report your team actually needs, including any non-Google sources. Check connector requirements before treating a working Google-only prototype as proof that the entire reporting stack is covered.
Verdict: Buy into the workflow when customization matters and your team can maintain the reporting logic; skip it as a hands-off solution.
4. Whatagraph: best for cross-channel marketing presentation
Whatagraph focuses on marketing reporting across connected sources. It brings marketing data into visual reports, making it a candidate when account teams need to present channel performance together.
The relevant distinction is presentation workflow. Your team needs a readable cross-channel narrative, not merely access to separate platform dashboards. That narrative still needs agreed conversion definitions and clear attribution boundaries.
Whatagraph pros:
- Centers the reporting experience on marketing data and metrics.
- Supports cross-source reporting rather than limiting the presentation to one advertising platform.
- Gives teams a shared visual format for explaining channel performance.
Whatagraph cons:
- Combining channel metrics does not reconcile conflicting attribution rules automatically.
- A clear visual report still needs an analyst to explain the evidence behind a proposed reallocation.
Best for: Agencies whose main requirement is presenting cross-channel marketing performance clearly.
Evaluate it with a difficult client question. Ask the account team to explain why platform conversions and CRM outcomes differ, then check whether the report makes that explanation easier to follow.
Do not judge only by the finished appearance. Check how the team handles naming changes, disconnected sources, revised conversion definitions, and a client's request for a different reporting view.
Verdict: Buy for marketing presentation; hold if your unresolved requirement is an auditable budget recommendation rather than a report.
5. Microsoft Power BI: best for centralized data modeling
Microsoft Power BI combines data transformation, modeling, and interactive reporting. It fits agencies that want a governed reporting foundation rather than a collection of independently maintained client dashboards.
Power Query supports data preparation, while semantic models and DAX support shared reporting logic. Those capabilities are useful when an agency has the technical ownership needed to maintain them.
Microsoft Power BI pros:
- Supports reusable data models and calculated measures.
- Provides data transformation tools for preparing inputs before reporting.
- Supports access controls, including row-level security, for governed reporting.
Microsoft Power BI cons:
- Model design and maintenance require technical responsibility.
- Sharing and client access need deliberate configuration, not just a finished report file.
Best for: Agencies with analytics specialists building a centralized reporting foundation.
Treat Microsoft Power BI as a reporting system to operate, not a template to install. Assign responsibility for source refreshes, model changes, access reviews, and the business meaning of every important measure.
Your 2026 evaluation should include the person who will maintain that system. A successful demonstration by a specialist does not establish that an account team can support it independently.
Verdict: Buy when you have a named model owner; skip it when nobody can maintain the underlying data system.
How we ranked the options
The ranking uses the criteria above: revenue context, client separation, recurring delivery, metric consistency, decision evidence, and maintenance burden. Each recommendation identifies a workflow fit, not a measured performance advantage.
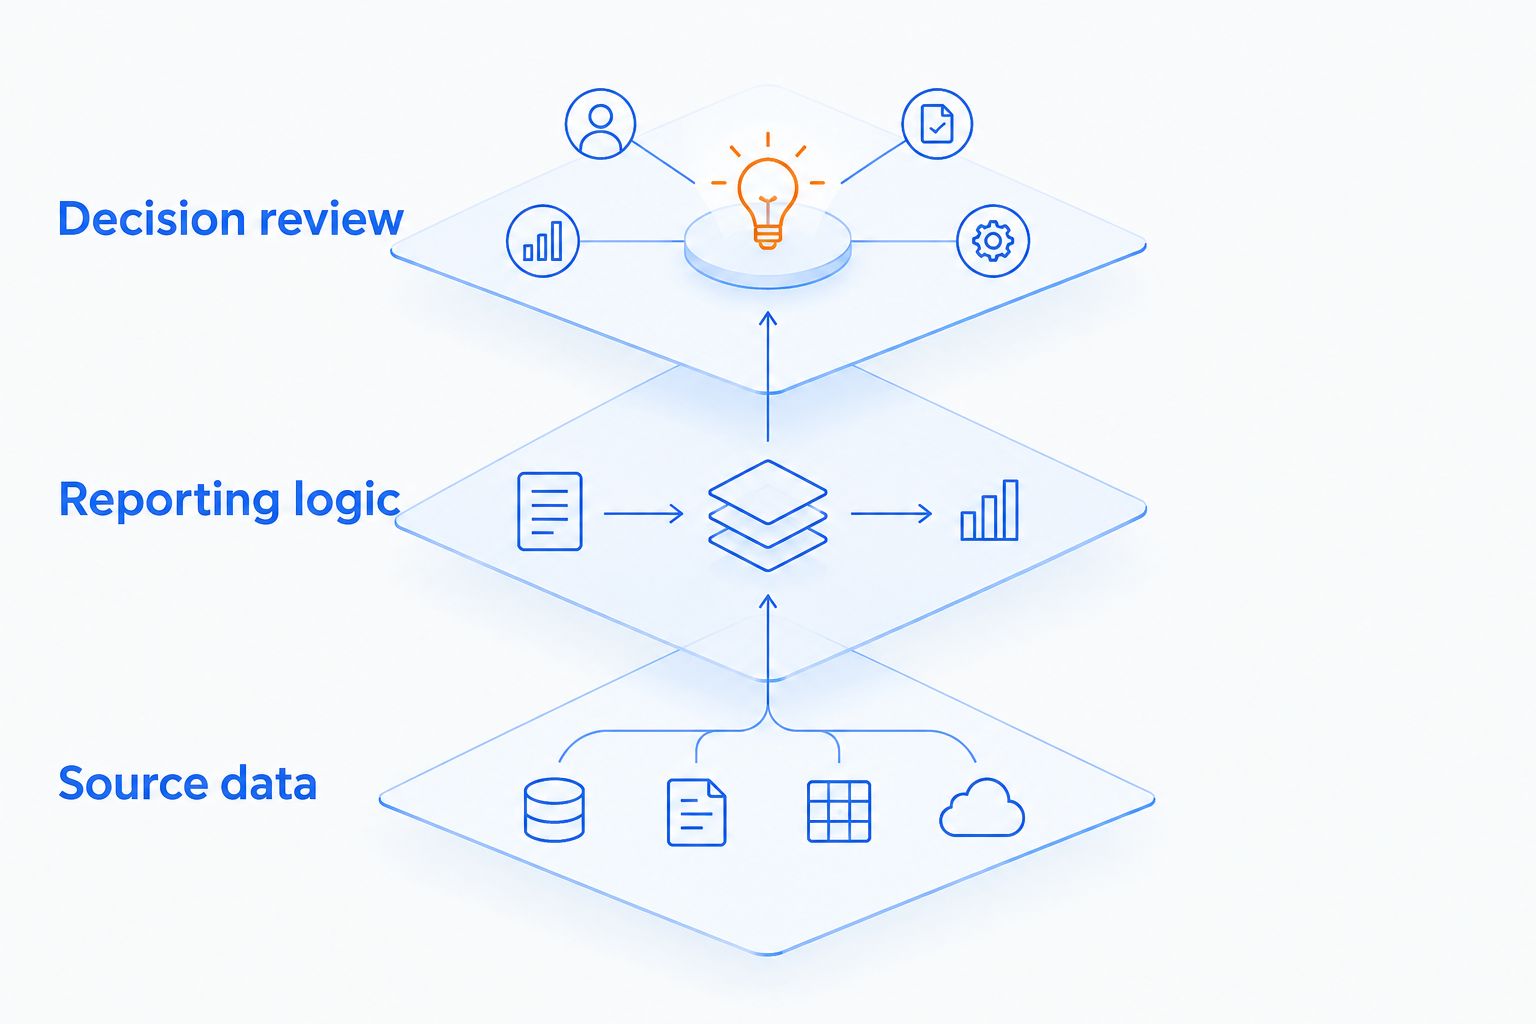
Separate your evaluation into 3 reporting layers:
- Source data: Advertising activity, analytics events, CRM stages, and revenue records.
- Reporting logic: Definitions, joins, attribution rules, and client-specific presentation.
- Decision review: Proposed changes, expected impact, supporting evidence, and limitations.
A platform can help with more than one layer. It does not remove your responsibility for the others. This separation prevents a good-looking report from being mistaken for a validated recommendation.
Run the evaluation on 1 client account with advertising data and CRM outcomes. Choose an account with a reporting question your team already understands, so you can distinguish software behavior from unfamiliar business conditions.
Then complete 2 review meetings: one with the report builder and one with the account owner. The builder checks definitions and connections. The account owner checks whether the output answers the client's questions without an analyst narrating every chart.
Record the decision you would make, the evidence supporting it, and the unresolved limitation. Do not assign a numeric confidence score yourself unless you have a defined scoring method.
Which agency analytics dashboard should you choose?
Choose for the deliverable you must defend. If that deliverable is a budget recommendation tied to CRM outcomes, evaluate the decision-intelligence option first. If it is recurring client reporting, start with AgencyAnalytics.
Choose Looker Studio for Google-focused customization, Whatagraph for cross-channel presentation, or Microsoft Power BI for a centrally maintained data model. None of those choices removes the need for agreed metrics and human review.
For your 2026 shortlist, reject any option that fails a required source connection or access requirement. A compelling demonstration does not compensate for a workflow your agency cannot operate.
If your immediate problem is defending reallocations rather than producing another dashboard, explore the private beta before committing to a reporting-system change.
Evaluate revenue-linked budget decisions
Explore the private beta for ranked recommendations connected to advertising, CRM, and revenue data.
FAQ
What's the best marketing analytics dashboard software for agencies?
The best choice depends on the deliverable: AgencyAnalytics for repeatable client reporting, Looker Studio for Google-focused customization, and Paid Lens for revenue-linked budget recommendations. Choose against required sources, reporting definitions, and the decisions your team must defend.
Is an analytics dashboard enough to make budget decisions?
No. A dashboard displays reported performance, but a budget decision also needs revenue context, supporting evidence, and a clear account of uncertainty. Attribution totals alone do not establish incremental impact.
Is Looker Studio better than AgencyAnalytics for agencies?
Looker Studio fits custom Google-focused reporting, while AgencyAnalytics fits repeatable agency client-reporting workflows. Compare the report-building and maintenance tasks your team will own rather than treating one as universally better.
Should an agency use Whatagraph or Microsoft Power BI?
Choose Whatagraph for marketing-focused cross-channel presentation and Microsoft Power BI for a centrally maintained data model. Microsoft Power BI requires an owner for modeling, access, and maintenance; presentation quality alone is not a reason to build that system.
What should an agency check before connecting CRM data?
Check lead and opportunity definitions, stage changes, revenue fields, identifiers, and the reporting period. Advertising activity and CRM outcomes need a defensible connection before you use them to recommend budget changes.
How should agencies evaluate these tools in 2026?
Evaluate the complete workflow on a real client account, from source connection to client explanation. Include both the report builder and the account owner, and record unresolved data or access limitations before deciding.
Can a confidence score replace human review?
No. A confidence score helps frame a recommendation, but it does not approve the underlying assumptions or authorize a budget change. Review the supporting evidence, data coverage, and business constraints before acting.
One last thing
Keep platform conversions and CRM outcomes visibly separate until you can explain their relationship. Combining them under one conversion label makes the dashboard simpler and the budget argument harder to defend.
Before approving a reallocation, ask the account owner to state the evidence and the strongest reason the recommendation might be wrong. If that explanation is unclear, fix the decision record before changing spend.